
COMING SOON! Get access to our new TSP calculators!
We will notify you when they are released. Click here and sign up for the email alert.
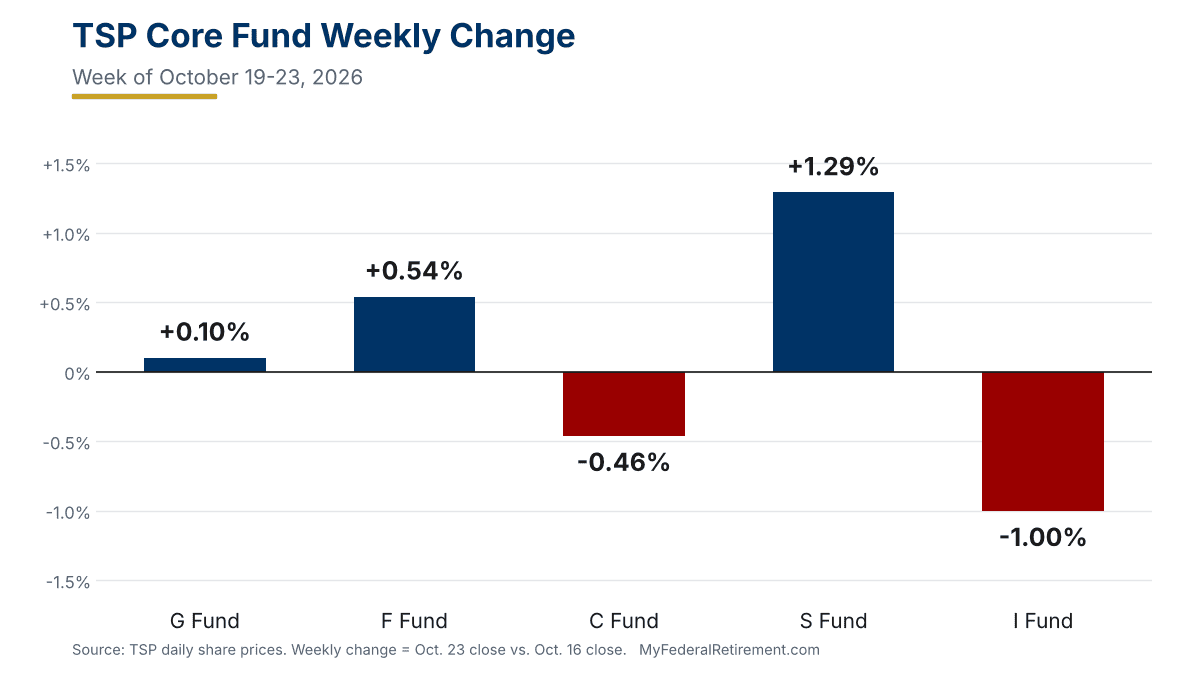
The Thrift Savings Plan (TSP) closed the week of October 19–23, 2026 with a sharp split between its stock funds. The S Fund finished as the week’s top performer, the F Fund and G Fund also gained, and the C Fund and I Fund slipped. Every Lifecycle (L) Fund ended the week lower, although L Income was close to flat.
What Drove the Week
The first half of the week was a rotation away from large technology companies. The Standard & Poor’s 500 Index (S&P 500), which the C Fund tracks, gained on Monday, Tuesday and Wednesday, but the strongest action was in smaller companies. On Tuesday, as longer-term Treasury yields eased, the Russell 2000 index of small-company stocks rose about 1.7%, its best day since early August, and the S Fund jumped 1.32%, its biggest daily gain of the week.
That momentum reversed on Thursday. A fresh wave of worry over artificial intelligence (AI) spending, including comments from Meta Platforms about how much funding the technology requires, hit chip and technology shares hard. The S&P 500 fell 1.21%, its worst day since July, and the Nasdaq Composite dropped 2.6%. Oil prices jumped at the same time on a flare-up in Middle East violence, with Brent crude settling near $117 a barrel. The C Fund lost 1.21% and the I Fund lost 1.47% on the day, while investors moved into bonds and pushed Treasury yields lower. That lifted the F Fund 0.83%, its best day of the week.
Friday added more pressure. Higher oil prices pushed the 10-year Treasury yield back to nearly 5%, and the S&P 500 slipped another 0.52% to 7,623.68. Chip stocks steadied after Thursday’s selloff, but the Dow Jones Industrial Average fell 1.23%. For the full week, the S&P 500 lost 0.47% and the Nasdaq lost 0.71%, while the Dow gained 0.41% and the Russell 2000 gained 2.00%. That gap between large technology names and the rest of the market explains why the S Fund finished ahead of the C Fund.
Ad
Claim Social Security at the wrong age, and the cost is permanent
Claiming too early can lock in a smaller check for the rest of your life — and there’s no do-over. This workshop lays out the real math behind timing it right, alongside everything else on your path to retirement. Get the details at a free FedImpact Workshop near you.
The I Fund had the weakest week of the core funds. International stocks felt the same AI and energy worries, and European markets also dealt with French fiscal and political concerns. The I Fund still leads every core fund year to date at +13.19%, with the C Fund close behind at +12.38%. The G Fund continued its steady daily accrual.
Core Funds
| Fund | Share Price | Weekly Change | YTD Return |
|---|---|---|---|
| G Fund | $20.3253 | +0.10% | +3.77% |
| F Fund | $20.6918 | +0.54% | -0.91% |
| C Fund | $123.0718 | -0.46% | +12.38% |
| S Fund | $111.0851 | +1.29% | +10.63% |
| I Fund | $62.8099 | -1.00% | +13.19% |
Lifecycle Funds
Each Lifecycle Fund finished the week lower. The longer-dated funds, which hold the largest share of stocks, lost the most, while L Income, the most conservative option, slipped just 0.02%. The L 2055 through L 2075 funds, which share the same aggressive allocation, moved in lockstep.
| Fund | Share Price | Weekly Change | YTD Return |
|---|---|---|---|
| L Income Fund | $31.0035 | -0.02% | +6.02% |
| L 2030 Fund | $63.0257 | -0.15% | +8.48% |
| L 2035 Fund | $19.3310 | -0.22% | +9.34% |
| L 2040 Fund | $74.4412 | -0.24% | +9.82% |
| L 2045 Fund | $20.6751 | -0.27% | +10.23% |
| L 2050 Fund | $45.9833 | -0.30% | +10.67% |
| L 2055 Fund | $24.0986 | -0.42% | +12.46% |
| L 2060 Fund | $24.0953 | -0.42% | +12.45% |
| L 2065 Fund | $24.0917 | -0.42% | +12.45% |
| L 2070 Fund | $14.2783 | -0.42% | +12.45% |
| L 2075 Fund | $12.4721 | -0.42% | +12.45% |
The Week Ahead
The Federal Open Market Committee (FOMC) meets October 27–28. After raising its target rate by a quarter point in September, the Federal Reserve is widely expected to hold steady in October, with markets leaning toward a possible increase in December. Several large technology companies also report earnings, and investors will be listening closely for any new commentary on AI spending. Oil prices and Treasury yields remain the swing factors for the TSP’s stock and bond funds.
For the longer view, see the latest monthly TSP fund returns. Official daily share prices are posted on the TSP share price history page.
Fund performance is based on TSP daily share prices. Weekly change compares the October 23 close with the October 16 close.