
TSP Returns for August 2026: Monthly, YTD and Annual Performance
Below are the Thrift Savings Plan fund performance figures for the G, F, C, S, I and L investment funds for August 2026, as calculated from official TSP daily share prices.
August 2026 Core TSP Fund Returns
| Fund | August Return | YTD Return | 12-Month Return |
|---|---|---|---|
| G Fund | +0.41% | +3.00% | +4.46% |
| F Fund | +0.40% | -0.16% | +1.94% |
| C Fund | +2.72% | +13.12% | +20.36% |
| S Fund | +2.27% | +16.10% | +18.68% |
| I Fund | +3.32% | +19.18% | +29.93% |
August 2026 TSP Lifecycle Fund Returns
| Fund | August Return | YTD Return | 12-Month Return |
|---|---|---|---|
| L Income | +1.11% | +6.34% | +9.46% |
| L 2030 | +1.75% | +9.78% | +14.90% |
| L 2035 | +2.04% | +11.15% | +16.73% |
| L 2040 | +2.19% | +11.87% | +17.84% |
| L 2045 | +2.31% | +12.50% | +18.80% |
| L 2050 | +2.43% | +13.14% | +19.78% |
| L 2055 | +2.85% | +15.57% | +23.35% |
| L 2060 | +2.86% | +15.57% | +23.35% |
| L 2065 | +2.86% | +15.57% | +23.35% |
| L 2070 | +2.85% | +15.56% | +23.34% |
| L 2075 | +2.86% | +15.56% | +23.34% |
Source: Daily closing share prices published by the Thrift Savings Plan (TSP.gov)
August 2026 TSP Performance Summary
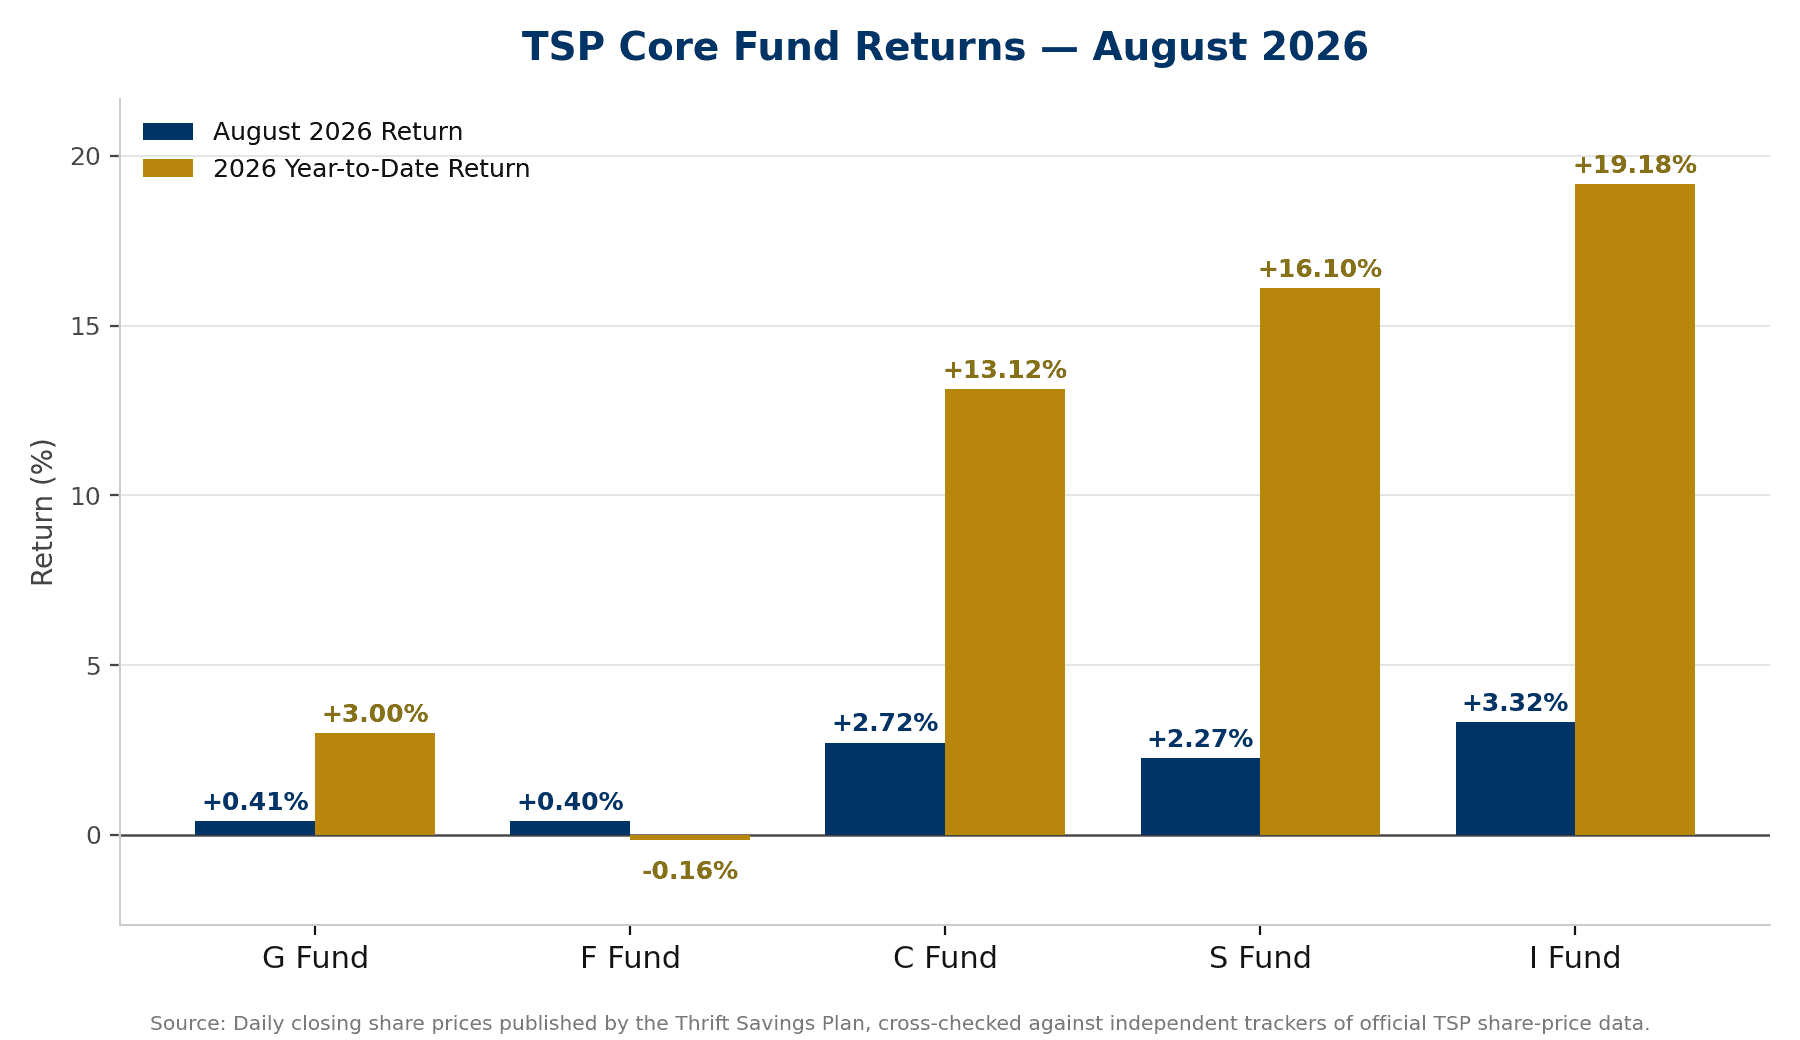
August broke in favor of every TSP fund. All five core funds and all eleven Lifecycle Funds closed the month in the black, a cleaner sweep than the mixed results TSP participants saw in July. The I Fund did the heavy lifting, gaining 3.32% for the month — its best single month since April and enough to push its year-to-date return to 19.18%, the strongest of any core fund in 2026.
The C and S Funds also posted solid, if less dramatic, gains. The C Fund added 2.72% in August, bringing its 2026 return to 13.12%. The S Fund rose 2.27%, lifting its year-to-date figure to 16.10%. Both funds remain well ahead of where they stood at the start of the year, even after accounting for the S Fund’s rough July.
The G and F Funds turned in their usual understated performances, up 0.41% and 0.40% respectively. The F Fund’s gain is worth a second look: bond returns can be choppy from week to week as interest-rate expectations shift, and a positive month for the F Fund isn’t guaranteed just because stocks are climbing. Its year-to-date return remains slightly negative at -0.16%, the only core fund still underwater for the year.
Looked at over the trailing 12 months, the I Fund’s 29.93% return stands well clear of the other core funds, followed by the C Fund at 20.36% and the S Fund at 18.68%. That gap is a reminder of how much international markets have contributed to TSP portfolios this year — a contribution that can reverse just as quickly as it appeared, given how currency swings and overseas market conditions factor into the I Fund’s results.
The Lifecycle Funds again showed the progression investors would expect: L Income, built mostly from the G and F Funds, gained the least at 1.11%, while L 2055 through L 2075 each rose roughly 2.85% to 2.86%, reflecting their heavier weighting toward the C, S and I Funds. Investors in the funds between those two ends saw gains that scaled with how far off their target retirement date sits.
One month of broad gains doesn’t erase the volatility TSP participants have lived through in 2026 — the I Fund alone has swung from a double-digit loss in March to a double-digit gain the following month, then cooled and rebounded again since. That pattern is a useful check on both overreacting to a strong month like August and reading too much into a rough one like July. For a closer look at staying disciplined through swings like these, see Insight on How Investors Should Respond to TSP Volatility.
Longer-Term TSP Performance
The following figures are annualized, meaning they show the average yearly return over each period rather than the cumulative return for the entire period. These figures are updated alongside the monthly returns using official TSP share-price data rather than waiting for TSP.gov’s longer-term performance table, which can lag the daily data.
| Fund | 1 Year | 3 Year | 5 Year | 10 Year |
|---|---|---|---|---|
| G Fund | +4.5% | +4.5% | +3.9% | +2.9% |
| F Fund | +1.9% | +4.1% | -0.2% | +1.5% |
| C Fund | +20.4% | +21.0% | +12.8% | +15.3% |
| S Fund | +18.7% | +18.3% | +6.2% | +11.7% |
| I Fund | +29.9% | +20.7% | +10.8% | +10.5% |
| L Income | +9.5% | +8.8% | +6.0% | +5.5% |
| L 2030 | +14.9% | +14.0% | +8.3% | +9.3% |
| L 2035 | +16.7% | +15.2% | +8.8% | — |
| L 2040 | +17.8% | +16.1% | +9.2% | +10.5% |
| L 2045 | +18.8% | +16.9% | +9.5% | — |
| L 2050 | +19.8% | +17.7% | +9.8% | +11.5% |
| L 2055 | +23.3% | +20.5% | +11.2% | — |
| L 2060 | +23.3% | +20.5% | +11.2% | — |
| L 2065 | +23.3% | +20.5% | +11.2% | — |
| L 2070 | +23.3% | — | — | — |
| L 2075 | +24.2% | — | — | — |
Dashes indicate that a fund has not existed long enough to produce a return for that period or that a cross-verified figure was not available at the time of publication.
The Five Individual TSP Investment Funds
Government Securities Investment Fund
The G Fund invests exclusively in short-term U.S. Treasury securities specially issued to the TSP. It provides returns based on longer-term Treasury rates without exposing participants to the risk of losing principal. Payment of principal and interest is guaranteed by the U.S. government. The G Fund’s interest rate is calculated monthly based on the market yields of outstanding Treasury securities with at least four years remaining until maturity.
More information is available from the TSP G Fund page.
Fixed Income Index Investment Fund
The F Fund invests in a bond index fund that tracks the Bloomberg U.S. Aggregate Bond Index. This broad index includes U.S. government, corporate, mortgage-backed and other investment-grade bonds. The F Fund can gain or lose value as market interest rates and bond prices change. It offers the possibility of higher long-term returns than short-term securities, but it does not protect participants from investment losses.
More information is available from the TSP F Fund page.
Common Stock Index Investment Fund
The C Fund tracks the Standard & Poor’s 500 Stock Index. The index consists of approximately 500 large and medium-sized U.S. companies representing a broad cross-section of the domestic economy. The C Fund offers the long-term growth potential associated with stock ownership, but its value rises and falls with the U.S. stock market.
More information is available from the TSP C Fund page.
Small Capitalization Stock Index Investment Fund
The S Fund tracks the Dow Jones U.S. Completion Total Stock Market Index. It invests in U.S. companies that are not included in the S&P 500, primarily providing exposure to small- and medium-sized businesses. The S Fund offers additional exposure to the U.S. stock market beyond the companies held by the C Fund. It can also experience greater price fluctuations than the C Fund.
More information is available from the TSP S Fund page.
International Stock Index Investment Fund
The I Fund tracks the MSCI ACWI IMI ex USA ex China ex Hong Kong Index. It provides exposure to thousands of companies in developed and emerging markets outside the United States while excluding investments in China and Hong Kong. The I Fund allows participants to diversify beyond the U.S. stock market. Its returns can be affected by overseas market performance, currency movements and political or economic developments in other countries.
More information is available from the TSP I Fund page.
What Are the TSP Lifecycle Funds?
The TSP Lifecycle Funds are diversified portfolios made up of the G, F, C, S and I Funds. Each Lifecycle Fund is designed for participants who expect to begin withdrawing their money during a particular period. Funds with distant target dates generally hold larger allocations to stocks, providing greater growth potential along with greater short-term volatility. As a Lifecycle Fund approaches its target date, its investment mix gradually becomes more conservative. The L Income Fund is designed for participants who are already withdrawing from their accounts or expect to begin withdrawals soon. The remaining Lifecycle Funds are identified by their target years, ranging from L 2030 through L 2075. For a look at one approach to structuring TSP withdrawals in retirement, see The Barbell: A Strategy for Managing the Thrift Savings Plan in Retirement.
Related TSP Resources
Participants can obtain official prices, returns and fund information through the TSP fund-performance section and the TSP share-price history.
- Insight on How Investors Should Respond to TSP Volatility
- The Barbell: A Strategy for Managing the Thrift Savings Plan in Retirement
- How Inflation is Affecting Federal Employees’ & Retirees’ Financial Security
- The TSP and Required Minimum Distributions (RMD)
- Understanding the Impact of TSP In-Service Withdrawals
- More Thrift Savings Plan Coverage