
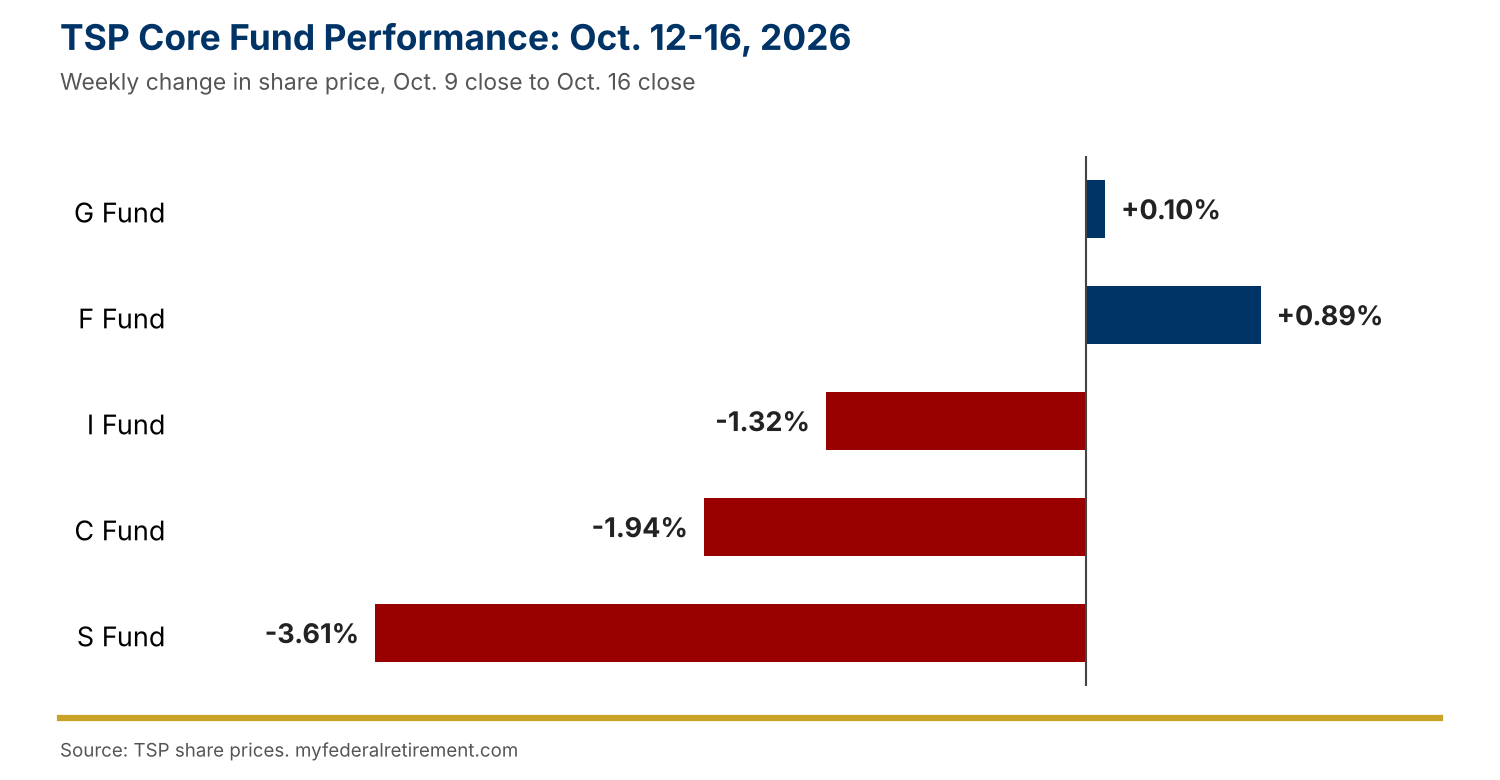
The Thrift Savings Plan (TSP) ended the week of October 12–16, 2026 with a sharp split between its bond and stock funds. The Government Securities Investment (G) Fund and Fixed Income Index Investment (F) Fund finished higher, while the Common Stock Index Investment (C) Fund, Small Cap Stock Index Investment (S) Fund and International Stock Index Investment (I) Fund all lost ground. Every Lifecycle (L) Fund ended the week lower.
What Drove the Week
The week began quietly. Stock markets were open for Columbus Day, but the TSP does not publish share prices on federal holidays, so Tuesday’s prices reflected the move from the prior Friday. The first round of bank earnings that day beat expectations, and the Standard & Poor’s 500 (S&P 500) index finished roughly flat, just under its record high from the week before.
Wednesday changed the tone. A September inflation report came in hotter than economists expected, with consumer prices up 3.7 percent from a year earlier against a forecast of 3.6 percent. Expectations for a Federal Reserve rate hike jumped, and the S&P 500 had its worst day since July. Higher borrowing costs are a particular concern for artificial intelligence (AI) companies that rely on debt to build data centers, and those stocks were the heaviest drag on the market. The S Fund fell the hardest, which is typical when rate worries build.
Thursday brought a rebound as Treasury yields eased and strong earnings lifted financial and health care shares. Friday erased much of it. Technology stocks sold off again, chipmakers fell for an eighth straight session, and oil prices climbed back above $100 a barrel. The S&P 500 and Nasdaq both posted their worst weeks since June, and the C Fund gave back more than the prior week’s gain while the S Fund fell for a second straight week.
The F Fund was the week’s top performer. Long-term Treasury yields eased from the multi-decade highs reached earlier in October, which lifted bond prices even as inflation worries grew. The I Fund declined less than the U.S. stock funds. The G Fund continued its steady daily accrual.
Retire before 62, and there’s a benefit most feds forget to plan around
The FERS Special Retirement Supplement can bridge the gap until Social Security kicks in — if you know the eligibility rules and how it’s taxed. This workshop covers it, plus everything else on your path to retirement. Get the details at a free FedImpact Workshop near you.
Core Funds
| Fund | Share Price | Weekly Change | YTD Return |
|---|---|---|---|
| G Fund | $20.3042 | +0.10% | +3.66% |
| F Fund | $20.5804 | +0.89% | -1.44% |
| C Fund | $123.6389 | -1.94% | +12.90% |
| S Fund | $109.6663 | -3.61% | +9.22% |
| I Fund | $63.4469 | -1.32% | +14.33% |
Lifecycle Funds
Each Lifecycle Fund finished the week lower. The longer-dated funds, which hold the largest share of stocks, lost the most, while L Income, the most conservative option, lost the least. The L 2055 through L 2075 funds, which share the same aggressive allocation, moved in lockstep.
| Fund | Share Price | Weekly Change | YTD Return |
|---|---|---|---|
| L Income Fund | $31.0096 | -0.43% | +6.04% |
| L 2030 Fund | $63.1176 | -0.93% | +8.64% |
| L 2035 Fund | $19.3727 | -1.20% | +9.58% |
| L 2040 Fund | $74.6230 | -1.31% | +10.09% |
| L 2045 Fund | $20.7309 | -1.41% | +10.53% |
| L 2050 Fund | $46.1200 | -1.52% | +10.99% |
| L 2055 Fund | $24.1994 | -1.92% | +12.93% |
| L 2060 Fund | $24.1959 | -1.92% | +12.92% |
| L 2065 Fund | $24.1923 | -1.92% | +12.92% |
| L 2070 Fund | $14.3379 | -1.92% | +12.92% |
| L 2075 Fund | $12.5242 | -1.92% | +12.92% |
The Week Ahead
The Federal Open Market Committee meets October 27–28, and Fed officials enter their pre-meeting quiet period with rate-hike odds still in play. Third-quarter earnings season continues, with AI-related companies under close watch. Oil prices and Treasury yields remain the swing factors for the TSP’s stock and bond funds.
For the longer view, see the latest monthly TSP fund returns. Official daily share prices are posted on the TSP share price history page.
Fund performance is based on TSP daily share prices.