
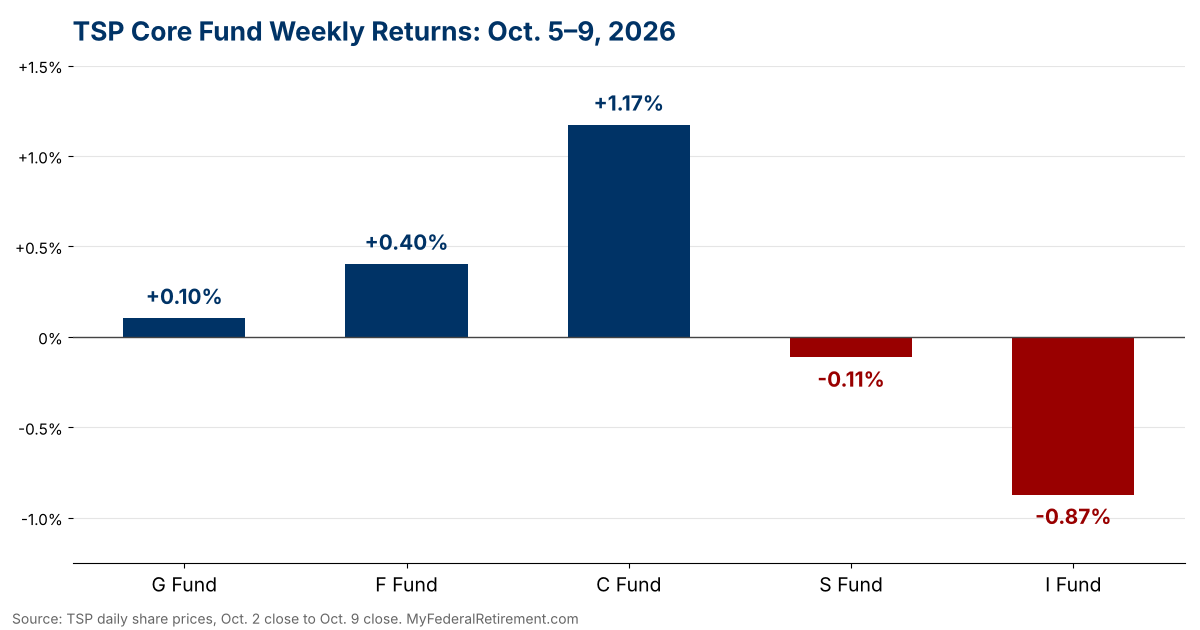
The Thrift Savings Plan (TSP) closed the week of October 5–9, 2026 with a split decision. The C Fund, F Fund and G Fund finished higher, the S Fund and I Fund finished lower, and every Lifecycle (L) Fund ended the week with a modest gain as the stock-heavy funds carried the lineup after a volatile midweek stretch.
What Drove the Week
Stocks started strong. The S&P 500 closed at a record on Tuesday, and the C Fund, which tracks that index, added to its gains on both Monday and Tuesday. The momentum faded on Wednesday and Thursday as oil prices swung on Middle East tensions and the 10-year Treasury yield pushed to its highest level since 2002, while a selloff in chip stocks weighed on the broader market. A Friday rebound, helped by optimism heading into third-quarter earnings season, erased most of that two-day pullback and left the C Fund as the week’s top performer.
The weakness was most visible in the S Fund and I Fund. Both dropped sharply on Wednesday, and the I Fund gave up more ground on Thursday before a partial recovery on Friday. The I Fund still leads every core fund year to date, but the C Fund has narrowed the gap.
The F Fund edged higher for the week even with long-term yields climbing, posting gains on Tuesday and Thursday that outweighed Monday’s dip. The G Fund continued its steady daily accrual.
Core Funds
| Fund | Share Price | Weekly Change | YTD Return |
|---|---|---|---|
| G Fund | $20.2831 | +0.10% | +3.55% |
| F Fund | $20.3997 | +0.40% | -2.31% |
| C Fund | $126.0804 | +1.17% | +15.13% |
| S Fund | $113.7780 | -0.11% | +13.32% |
| I Fund | $64.2966 | -0.87% | +15.87% |
Lifecycle Funds
Each Lifecycle Fund finished the week higher. The longer-dated funds, which hold the largest share of stocks, gained the most, while L Income, the most conservative option, posted the smallest increase. The L 2055 through L 2075 funds, which share the same aggressive allocation, moved in lockstep.
| Fund | Share Price | Weekly Change | YTD Return |
|---|---|---|---|
| L Income Fund | $31.1449 | +0.18% | +6.50% |
| L 2030 Fund | $63.7088 | +0.22% | +9.66% |
| L 2035 Fund | $19.6078 | +0.25% | +10.91% |
| L 2040 Fund | $75.6168 | +0.26% | +11.55% |
| L 2045 Fund | $21.0283 | +0.27% | +12.11% |
| L 2050 Fund | $46.8306 | +0.28% | +12.70% |
| L 2055 Fund | $24.6724 | +0.29% | +15.13% |
| L 2060 Fund | $24.6687 | +0.29% | +15.13% |
| L 2065 Fund | $24.6649 | +0.29% | +15.13% |
| L 2070 Fund | $14.6179 | +0.29% | +15.12% |
| L 2075 Fund | $12.7688 | +0.29% | +15.12% |
The Week Ahead
Third-quarter earnings season gets underway next week, with several major banks scheduled to report, and fresh inflation readings are due. Oil prices and Treasury yields remain the swing factors for the TSP’s stock and bond funds.

For the longer view, see the latest monthly TSP fund returns. Official daily share prices are posted on the TSP share price history page.
Fund performance is based on TSP daily share prices.