
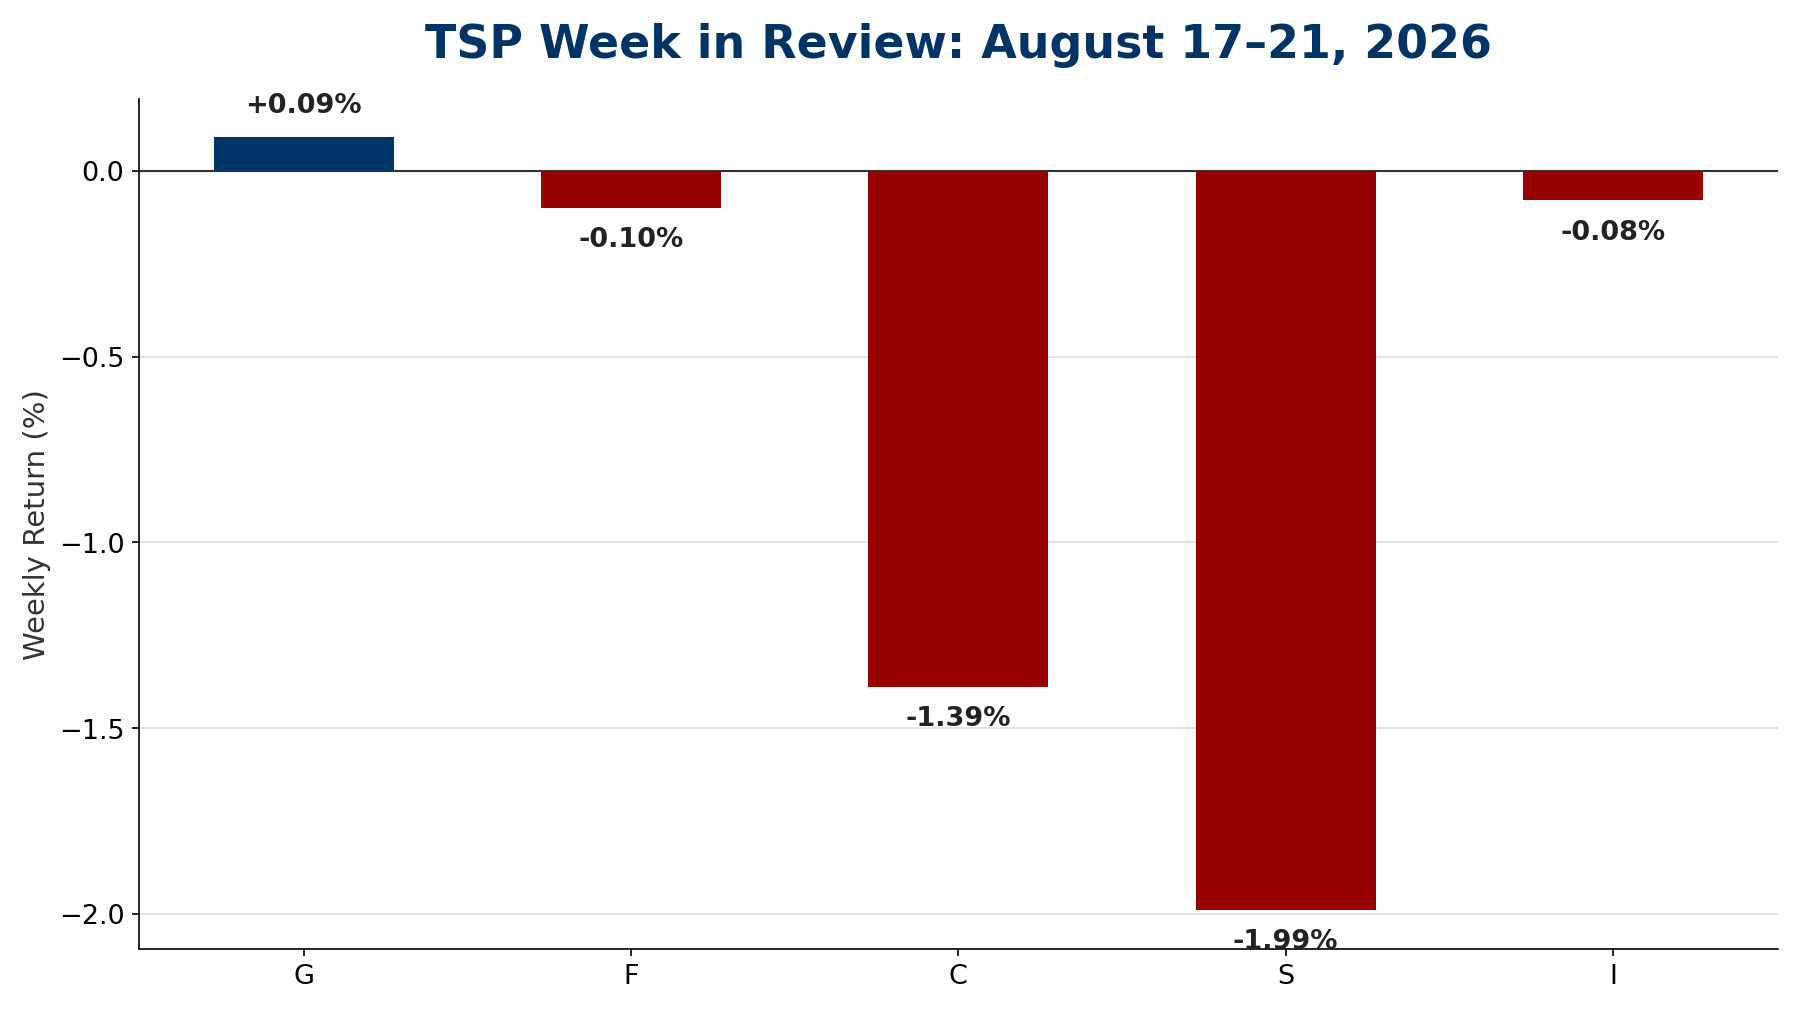
Most TSP fund prices slipped last week as stocks gave back some of August’s earlier gains. The S Fund led the decline, the C and I Funds also finished lower, and the G Fund posted its usual small, steady gain. Here’s how each fund performed for the week of August 17–21, 2026.
Core Fund Performance
| Fund | Weekly Return |
|---|---|
| G Fund | +0.09% |
| F Fund | -0.10% |
| C Fund | -1.39% |
| S Fund | -1.99% |
| I Fund | -0.08% |
Lifecycle Fund Performance
| Fund | Weekly Return |
|---|---|
| L Income | -0.23% |
| L 2030 | -0.51% |
| L 2035 | -0.65% |
| L 2040 | -0.71% |
| L 2045 | -0.77% |
| L 2050 | -0.82% |
| L 2055 | -1.00% |
| L 2060 | -1.00% |
| L 2065 | -1.00% |
| L 2070 | -1.00% |
| L 2075 | -1.00% |
What Drove This Week’s Moves
Stocks lost ground during a choppy week, with Tuesday doing much of the early damage. The S Fund fell 1.64% that day, followed by another 1.17% decline on Thursday. Small- and mid-cap stocks bore the brunt of the selling, which is why the S Fund’s weekly loss of nearly 2% outpaced the C Fund’s 1.39% decline by a wide margin. The I Fund followed a similar path lower before recovering most of its losses on Friday, when it gained just over 1% to end the week down only 0.08%.
A Friday rebound across the stock funds kept the week from being worse: the C, S, and I Funds all posted gains on the final trading day, cutting into losses that had built up earlier in the week. The G Fund continued its steady, uninterrupted climb, and the Lifecycle Funds moved in line with their underlying stock exposure, with the more conservative L Income Fund losing just 0.23% while the longer-dated L Funds, which hold the most stock, each fell right around 1%.